Elementary POS offers a range of useful features to help you quickly and easily access all your sales data. One such feature is the ability to generate customized sales reports in the Back Office of our POS system.
With the reports, you can quickly determine which of your sales items or categories were the most profitable within your chosen period.
How to?
1. In the Back Office, select “Stock status” and “Calculate stock”.
2. Customize your report by selecting a date range and tapping on “Export”.
3. Open the exported report in Excel.
4. Navigate to the bottom of your screen and select either “Grouped by item” or “Grouped by category”.

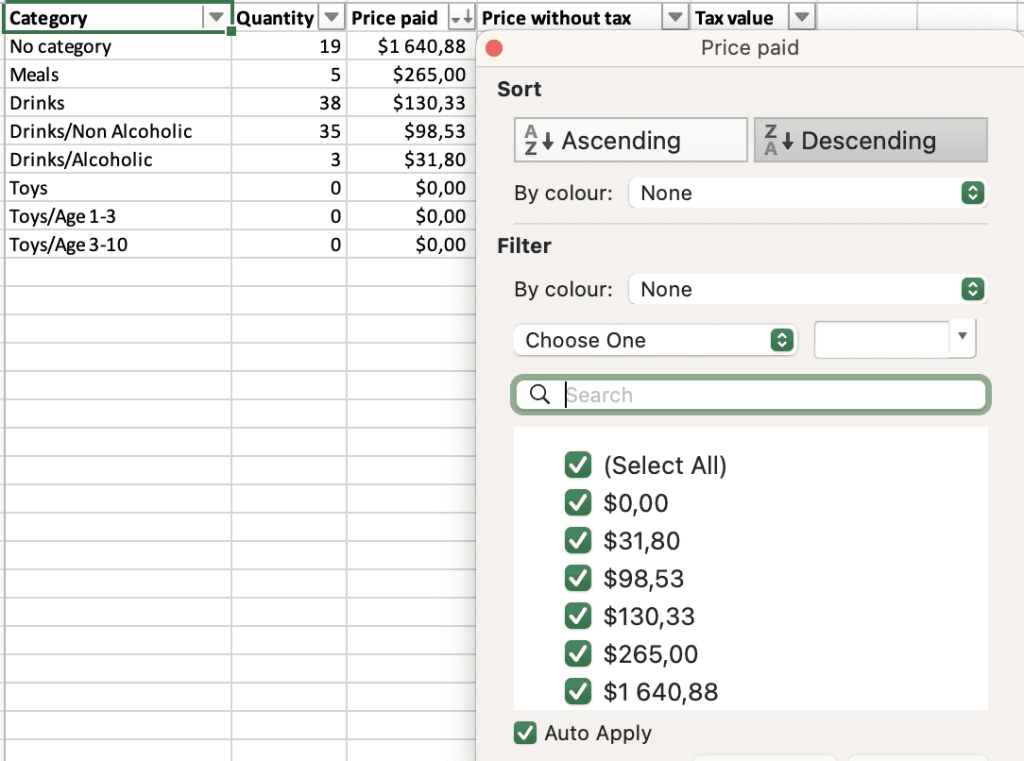
5. Order your sales items or categories in descending order based on “Price paid.” This will allow you to easily identify the sales categories with the highest revenue, which will appear at the top of the list.

By following these simple steps, you can gain valuable insights into your sales performance and make informed decisions to optimize your business’s profitability.


