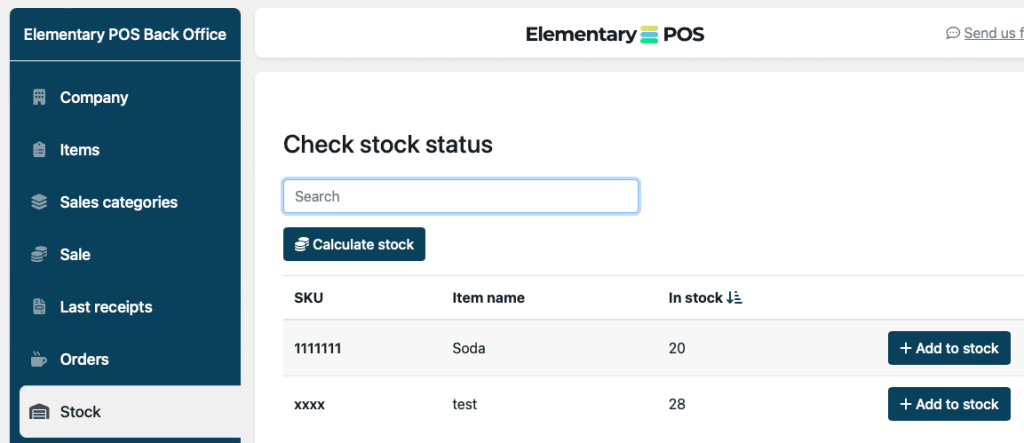
In this article, we’ll go through another feature of the Elementary POS app: the Stock. In this virtual warehouse, you can store information on the numbers of items you have available for sale. Let’s go through how to use the Stock feature!
In order to be able to use Stock, you need to set up a SKU code for each of your items, which is a unique identifier of the article. It can be a randomly generated number, but you can also use the barcode as the SKU code.
In the Free version of our POS system, you are limited to setting up 4 SKU codes.
As you make transactions with your mobile cash register, Elementary POS records all sales of a given item. If the items are assigned an SKU code, the system is able to sync the sales data with the Stock and alert you when you’re running out of something, or show you your current item numbers in an Excel export.
How to enter sales items to Stock?
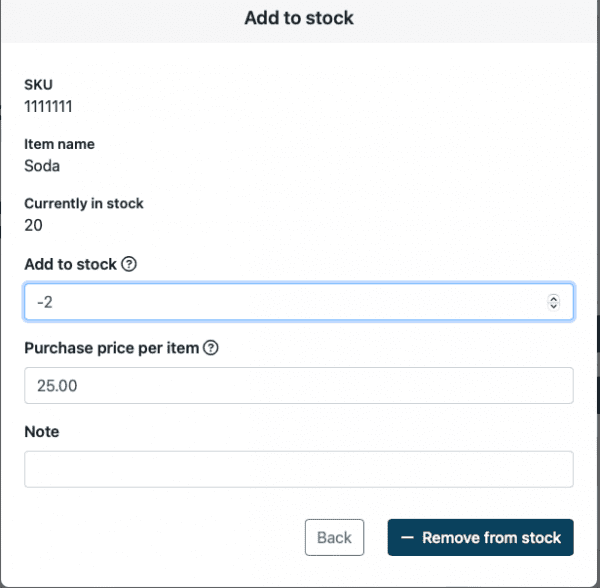
You need to first sign in to the Elementary POS Back Office. Afterwards, select Add to stock, enter the name of the item, the SKU code and the amount.

When you make a transaction, the item quantity and price are defined. If a tax has been set up, the final price of the item already includes it.
If you retrieve items from your stock, you’ll want to enter a negative quantity of respective items in the app (eg. -2 Lemonades), which will then be reflected in the inventory.

See all your Stock data in an Excel report
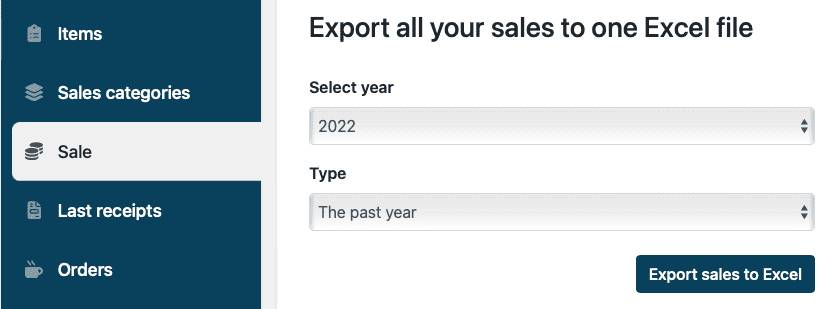
Elementary POS automatically calculates how many items remain in your Stock, their total value and how much profit was made on each individual sales item. If you’d like to see all this data listed in one place, you can do so by downloading a report. Just like the Stock feature, you get your reports from the Elementary POS Back Office.

The reports include statistics that can help you better see through your business, such as the following:
- specify a time-frame for the report. That way, you can view your sales and profits for a specific item in a specific period of time.
- see how many items have you stocked and the value of each of those
- see how many items have you sold at what price
- see how many items remain in stock and what is their value
- see your “gross profit” (the difference between sales and purchases, taking into account the value of items in stock, the amounts include tax)
- net profit: your gross profit minus tax
- newly, the reports also group your sales based on their categories (therefore, you can e.g. filter your last month’s sales of soft drinks)
If you’re unsure about anything regarding reports, you can do some reading right here. Should you still remain with unanswered questions, you can contact us via the customer support e-mail!


